Unit Economics And Your Margin Mix

When a customers buys something from you, where exactly does that money go?
This shouldn’t be a hard question, but you’d be surprised at how many business owners can’t give you an answer, not even a broad estimate.
To answer the question, we need four pieces of information:
1. To know how much our customer is paying us
2. To know how much the product/service cost us to deliver
3. To know how much the our business costs to run at its current size
4. To know where our profit/surplus goes
Luckily, each of these pieces of information can be found with some quick research and some basic maths.
These calculations give us “X-Ray Vision” for our line-up of products and services.
If we can see how much they cost us, we can spot problems and opportunities today, rather than in hindsight.

Isaac and Tomer’s High School Hustle
Back when Isaac was twelve years old, he and his friend Tomer started a rival business to their high school’s existing canteen.
Their argument: the canteen was too expensive, open limited hours and thought they could create a cheaper alternative, specialising in cans of Coca Cola and other soft drinks for $1.
They fished an old refrigerator out of hard rubbish, cleaned it up and kept it in their homeroom.
Luckily, their school principal was supportive, and didn’t charge them any rent or utilities, and Isaac’s dad would drive him to school with another 150 cans every week.
You could buy 30 cans of Coca Cola for $15, and the two of them split the profits evenly.
So our unit economic breakdown would be:
Revenue: $1
Cost Of Goods Sold: 50c (30 cans for $15)
Overheads: $0
Profit: 50c (25c to Isaac, 25c to Tomer)
It’s the world’s simplest business.
If you shopped around, you could find cans for 38c each, meaning more profit for each owner.
Colin Harmon, What I Know About Running Coffee Shops
Colin Harmon’s Takeaway Latte
Colin Harmon owns a series of cafes in Ireland, and wrote an excellent book called “What I Know About Running Coffee Shops”.
He outlines how takeaway coffees work, and why they aren’t as lucrative as you might think.
Here’s a paraphrase of his unit economic breakdown:
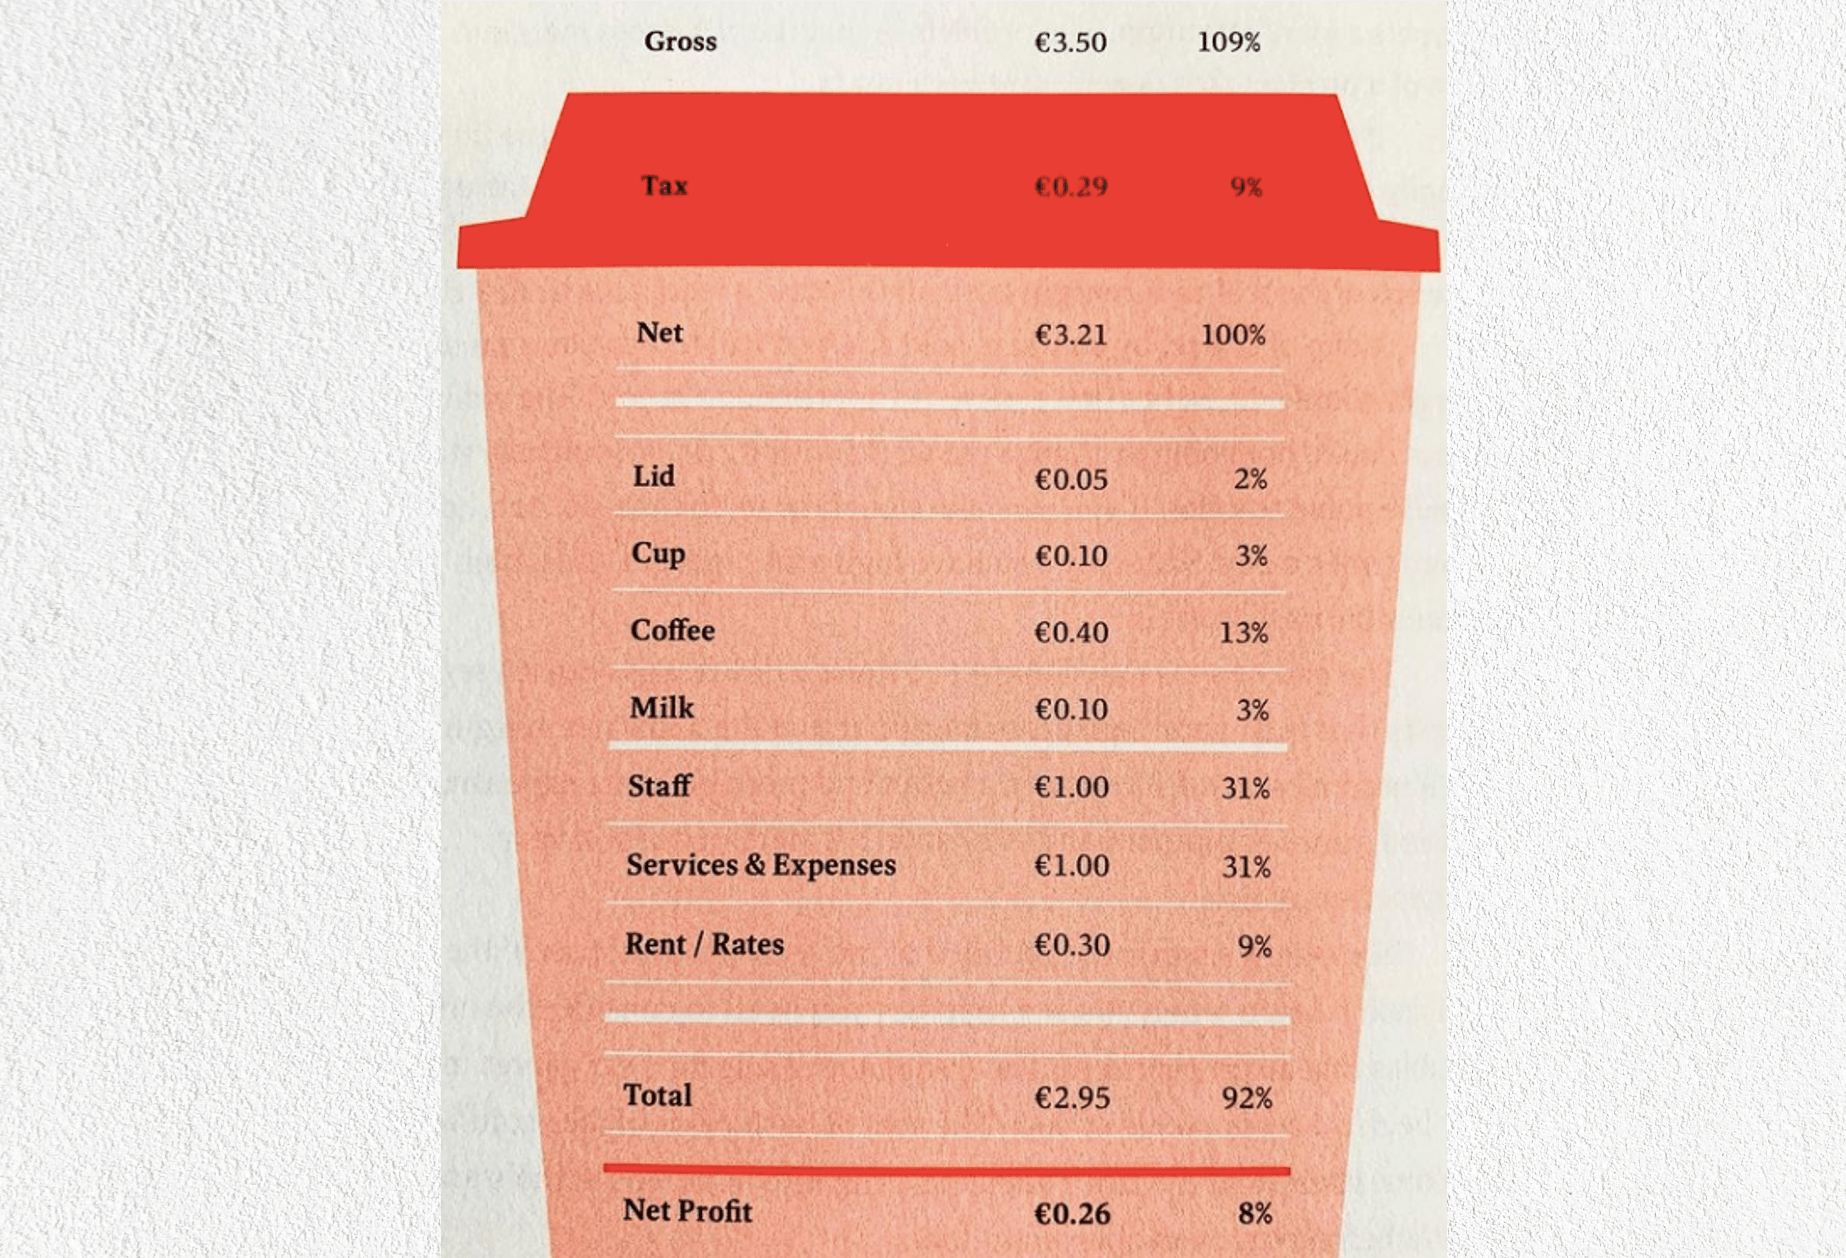
The customer pays $3.50, but after sales tax, the café is only taking $3.21.
A takeaway latte has four components: the lid, the cup, the coffee and the milk.
Each of these components is bought in bulk, but we can divide the bulk order by the number of lattes it makes.e.g. if we pay $50 for 1,000 lids, we can calculate that it’s 5c per lid.
Lids are 5c, cups are 10c, coffee is 40c and milk is 10c.
That totals up to 65c worth of ingredients per latte, but that’s just the cost of goods, not the cost of running a café.
Running a café is expensive; the staff costs alone equate to $1 per customer (dividing the total staff costs for the day by the number of drinks sold).
Then there’s all of the services and expenses, like utilities, phones, internet, cleaning etc, all of which also equate to $1 per latte.
Finally there’s the rent and council rates for the café, which when divided by the number of drinks sold each day comes to 30c each.
So all of those overheads come to $2.30, more than 3x the cost of goods sold.
Tallying them all up, we have $3.21 coming in, and $2.95 (65c + $2.30) going out.
That leaves a margin of 26c per cup.
Another way of looking at these numbers: 21% of that income goes to Cost of Goods, 71% goes to overheads, and the business is left with an 8% margin.
8% isn’t terrible, but it’s delicate, and so a change to Colin’s staff costs can turn an otherwise good day into an unprofitable one.
These examples are helpful because they show us if and when a business is sustainable.
Isaac and Tomer made a great margin, but in small quantities and with subsidised overheads.
Colin Harmon makes 8% from his coffee, more if they’re busy, less if they’re empty, and the maths might be different for tea or chai or hot chocolate.
His happy customers are likely to also buy higher margin products like bags of coffee beans, which make significantly more money.
These numbers don’t need to be pinpoint accurate, but accurate enough to show us the real story for each of our products and services.
With the real story, we can make great decisions.

Calculating Your Own Numbers
The first thing to do is to write out literally everything that goes into making your products/services and in keeping the business running.
Insurance, packaging, heating, marketing, any and every substantial expense.
To jog your memory, have a quick look through your bank statements.
The second step is to do some “batch cost calculations”.
Since most businesses aren’t creating their products and services individually, it’s helpful to determine the cost of a batch of those products/services, then divide that figure by how many items/services you sold.
e.g. you might have bought an order of 250 mailer boxes, 500 stickers, 100 stamps, etc, and divide the cost of each bulk order by the number of units it served (so it might be $1.10 per mailer, 10c per sticker, $5 in stamps, for a total of $6.20 per order).
The same goes for your overheads, these can be divided to give a “rule of thumb” number per unit.
It won’t be precise and it doesn’t need to be, for now.
The third step is to see what margin you’re anticipated to make, and when you’re scheduled to break even.
Some businesses break even really early, but might have a limited upside, like if you take orders from customers before placing orders with suppliers.
You’d be profitable almost from the beginning, but growing larger can feel quite slow.
Other businesses have a higher ceiling, but also a higher breakeven point.
e.g. you might order 1,000 units and break even after 640, so selling 950 makes a huge profit but selling 600 makes a loss.
You can do this by taking the price the customer pays, and subtracting the Cost of Goods Sold.
That gives you your “Contribution Margin”, the amount each unit “contributes” towards your running costs.
So if you sell something for $40 and it costs $25 to produce, each unit contributes $15.
If you then have $4,560 worth of overheads, then we can divide $4,560 by $15 to see that the breakeven point is 304 units sold.

You’re Unlikely To Find A Template, And That’s Probably Good
Right now you’re probably thinking “I hope there’s a template I can fill in, preferably with suggested amounts for some of these costs”.
Nope.
There isn’t and there shouldn’t be, since it will look so different for each industry.
Half of the benefit is in getting your head around how your industry and business model works, and you get that by building your own financials.
A catering company is totally different to a school or an ecommerce business or a pharmaceutical company.
You’ll develop a new appreciation for how and why your business spends money, and will likely find areas to either save money or spend extra to get a much better result.
You can’t outsource all of this to your accountant.
By all means work with an accountant, but you need to see how the machine works so you know how to spot trouble.
The process of making your own template, experimenting with it and then comparing your guesses to reality is what makes you confident and comfortable with the numbers.
If that’s making you feel ill, a good option is to co-create your financials with a coach or advisor.
They can walk you through the process, but you still get to do the interesting parts of the work.
They’ll also make the process much faster, and with fewer frustrations.

It Depends…
The answer to “Each time we sell something, where does the money go?” probably starts with the words “It depends…”.
That’s not a cop-out, that’s business.
If you were baking a chocolate cake, the cost of making that cake would be different to the cost of making 100 cakes in a day.
There would be efficiencies in making 100; you’d buy in bulk, and you can probably speed things up by working in batches or a production line.
Sometimes you spend a lot more just to serve one more customer; you might be able to do 90 cakes per day in a small kitchen, but going to 100 per day requires more staff and a bigger oven.
The cost per cake at 100 per day might actually be higher than at 90 per day, but then it might get cheaper once you’re at 130 per day.
That’s the point; to investigate where the money goes in different scenarios.
You want to know where the money goes today and where it would go in the future, and determine what sort of business you want to run.
Unit Economics For The Whole Menu
Most businesses aren’t selling one uniform product or service – there’s a menu of options and upgrades, each with different price points.
If you’re hoping “maybe we can just do this once and extrapolate from there?”, this will be annoying news, but you genuinely benefit from repeating this process for all of your menu items.
There are a few reasons why:
Some customers take longer to serve, so the staff costs are higher
Some products and services use more materials, or have materials that can’t be bought in bulk, leading to higher per-unit costs
You can better set your prices across the whole menu
You can justify the difference in price if customers ask about them
You can use some menu items to subsidise others
What you’re likely to discover is that most businesses have a “margin mix”, where some items make a lot of surplus, some scrape by and some actually lose money.
It might be that the market won’t bear the true cost of a particular product or service.
Maybe customers are used to paying a lot more than what it costs to produce something.
While it might seem democratic to apply a thin margin across all of the things you sell, you’ll likely find more success by adjusting your margins to suit your customers, and find a balance that doesn’t put you at risk of losing money.
Broadly speaking, we can group your menu items into three categories:

Cash Cows
A Cash Cow is a product or service that earns a heavy margin and delights a customer.
Cash Cows aren’t rip-offs, they are popular and attract a higher price point than what they cost.
There’s nothing immoral about earning a high margin, so long as everyone is happy.
e.g. a concert ticket, a business class flight, an eye fillet steak, a designer bag or an iPhone.
Customers love them, and they generate serious margins.
Isaac and Tomer’s drinks were a series of very small cash cows with high margins.
Cash Cows are often achievable through Value Based Pricing – where you can offer a customer something really valuable to them, even though it doesn’t cost you very much to produce.
Cash Cows are excellent.

Small Margins
A Small Margin item is something that you sell in high volume, but only charge a little more than what it costs you to produce.
Lots of products are sold like this, where the business owner charges a fair price for a commodity good.
This goes for petrol, chocolate bars, Dell computers, budget airline tickets or phone credit.
In the earlier example, we saw Colin Harmon’s latte was a Small Margin product.
Customers love them, and they keep the business ticking along.
There’s not much room for error, but you also won’t be accused of profiteering.
Small Margins are often achievable through Cost Based or Market Based pricing, where you charge “the going rate” for something generic and interchangeable.
Small Margins are excellent.

Loss Leaders
A Loss Leader is a product or service that costs more than it earns, and sets up a second purchase that generates a heavier margin.
Many businesses create loyal customers through loss leaders, because they necessitate the additional purchases that then become Cash Cows.
This is why some bars offer free salty snacks like nuts or pretzels – to sell more drinks.
This goes for video game consoles, milk at the supermarket, razor handles, printers and Nespresso machines.
The initial purchase makes no margin, but the necessary follow-ups are highly lucrative.
Loss Leaders are sometimes excellent.
For example, your brand might have Cash Cow services that customers love, some Small Margin products and accessories, and then have some Loss Leader activities like a YouTube channel or a stall at local events.
They are all great, and they reinforce each other, so long as they’re in the right proportion.
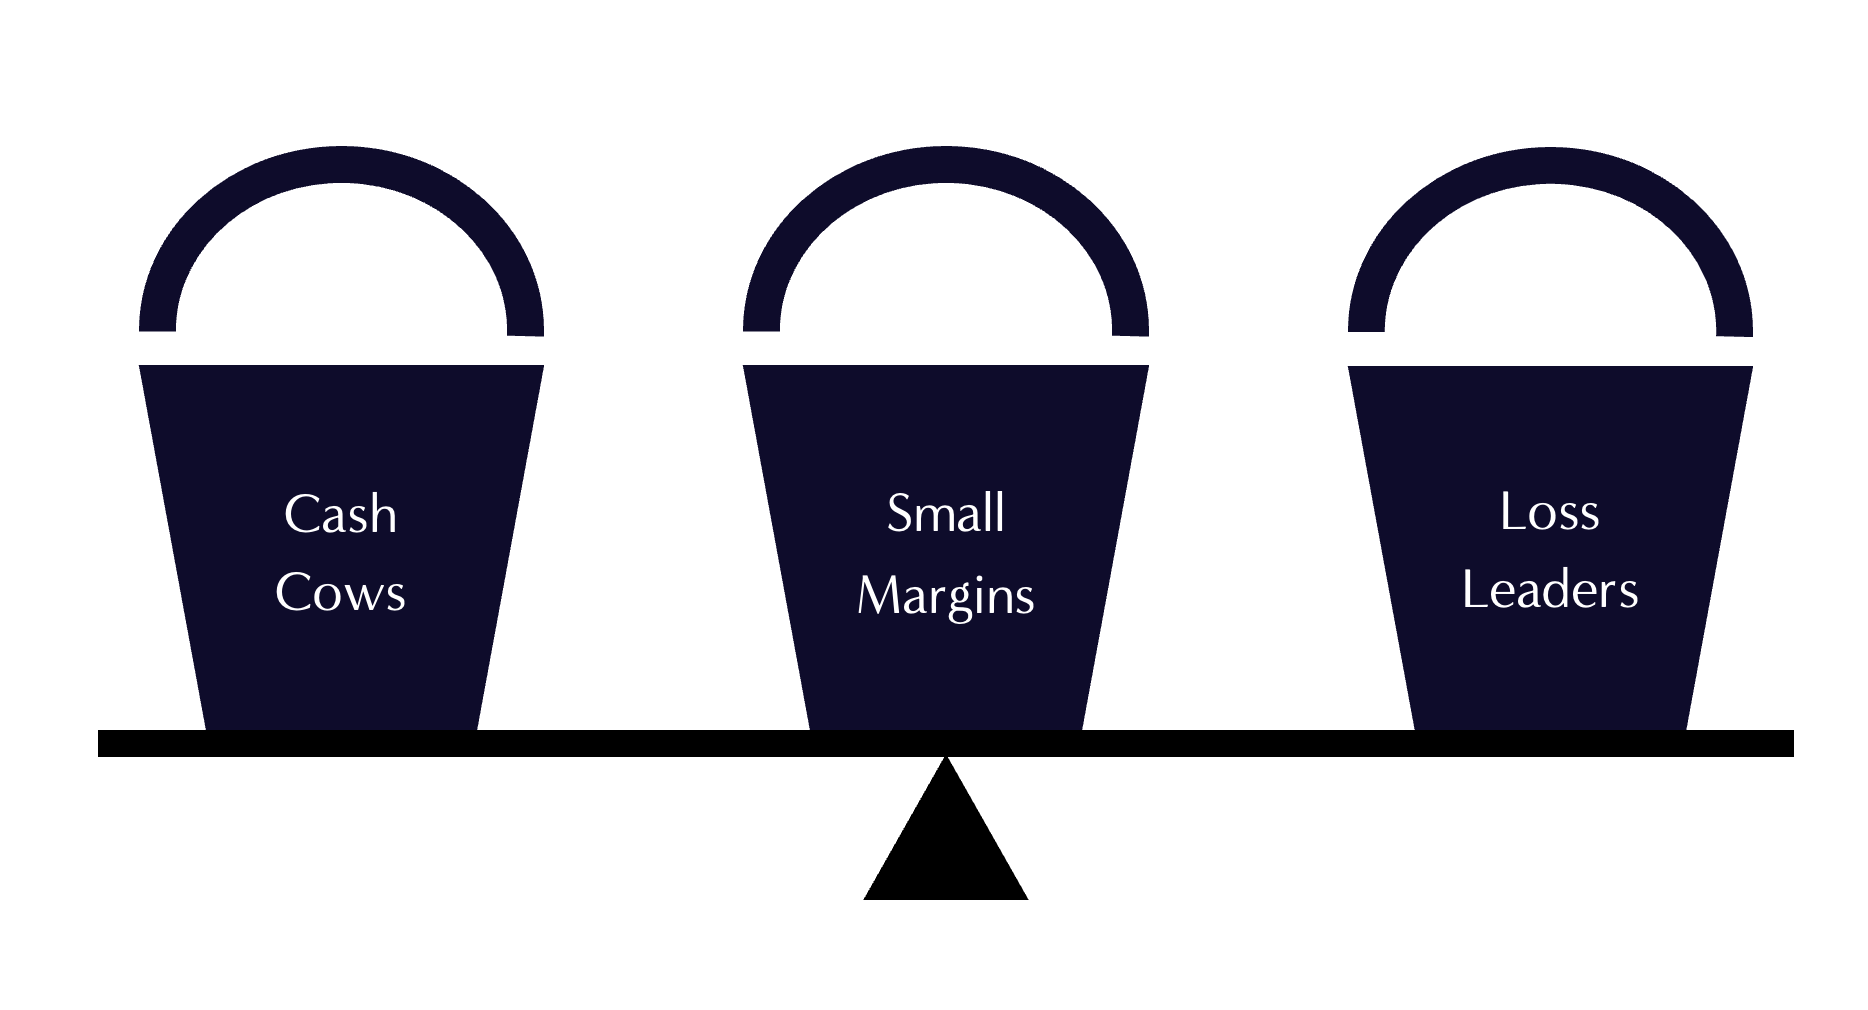
It turns out, these three buckets are sitting on a see-saw.
On the left are our Cash Cows, on the right are our Loss Leaders, and the Small Margins are just to the left of the centre.
Here’s the deal – you can have any combination you like, so long as the scales tip towards the left.
That’s financial sustainability.
If it tips to the right, you’re not financially sustainable.
The Three Lies
What tends to happen at this point is the entrepreneur tells themselves one of three lies.
Lie #1 – Pretending a Small Margin item is a Cash Cow
This is easy to do, since a lot of your business’s costs are invisible at first, especially the cost of your time.
The revenue feels like it outweighs the costs, but when we zoom out, we see that things aren’t so lucrative.
We’re not keeping much milk from the Cash Cow.
Lie #2 – Pretending a Loss Leader is a Small Margin
This is also easy to do, since those invisible costs stay hidden.
We can see some income from our activities, but the amount of work involved means that it hasn’t actually made a profit, at least not in this first instance.
If this becomes the first of many purchases, then we’ll make a margin, but in this case it’s been an overall loss.
Lie #3 – Pretending a Loss is a Loss Leader
A Loss Leader that doesn’t lead to anything is…a loss.
There’s really no way to celebrate a loss.
We can celebrate the use of a Loss Leader to acquire a new customer, but if it doesn’t work then we have to admit what’s happened.
This lie is often accompanied by words like “good exposure”, but this is a consolation prize at best.
If you can’t identify what it will lead to, then it’s not a Loss Leader.
These two approaches – unit economics and margin mix – allow you to zoom in and zoom out on your financials.
By calculating where the money goes for each product/service, you can understand which menu items are making a margin.
That helps us determine what’s a Cash Cow, a Small Margin and a Loss Leader.
With this clarity, you and your team can see the bigger financial picture: are we making money, under what circumstances, and do we want to make any changes?
There is no possible scenario where it’s better to keep yourself in the dark.
Financial clarity makes you better at your work, it gives you the best chance of staying afloat, and the opportunity to create more positive impact.
Time to start tallying up your batch costs…